近年来,入侵植物介导的环境生态风险日益凸显。因此,阐明入侵植物成功入侵的关键驱动机理,已成为当前入侵生态学领域备受关注的重大前沿科学问题之一。
更为重要的是,一种入侵植物成功入侵后,可以创造一个利于其他入侵植物成功入侵的微环境条件,进而可以明显提升其他种类的入侵植物成功入侵的几率,从而导致同一生境中受到两种甚至是多种入侵植物的共同入侵(Co-invasion),也称次生入侵(Secondary invasion),或协同入侵(Mutualist facilitation),或入侵塌陷(Invasional meltdown),或入侵漩涡(Invasional vortex)。换言之,不同种类的入侵植物可以互相作用,且可以共同参与新架构的多物种生态互作网络(Multispecies ecological interaction networks),并互相利于彼此的入侵进程,进而导致已被一种入侵植物成功入侵的生境可能更易遭受其他种类的入侵植物的成功入侵,从而形成了生物入侵进程中的马太效应(Matthew Effect),且可能对环境健康与生态安全造成了新的、更复杂的、更严重的生态影响。
虽然其他种类的入侵植物也可以在同一生境中形成共同入侵,但形成的频次相对不高,且形成的共同入侵的植物群落的面积也相对不大。而菊科入侵植物(不管是否可以进行克隆繁殖)却常常可以在同一生境中形成共同入侵,且形成的频次相对更高,其形成的共同入侵的植物群落的面积也相对更大、群落密度更高、影响范围更广、环境生态风险更强。特别是在苏南地区,诸多菊科入侵植物,如加拿大一枝黄花(Solidago canadensis L.)、一年蓬(Erigeron annuus (L.) Pers.)、春飞蓬(Erigeron philadelphicus L.)、小蓬草(Erigeron canadensis L.)、苏门白酒草(Erigeron sumatrensis Retz.)、鬼针草(Bidens pilosa L.)、大狼耙草(Bidens frondosa L.)和豚草(Ambrosia artemisiifolia L.)等,均常常在同一生境中形成共同入侵,且形成的共同入侵的植物群落的面积也相对更大,如两种菊科入侵植物共同入侵、三种菊科入侵植物共同入侵,甚至还有更多种类的菊科入侵植物共同入侵。
因此,亟待深入解析并进一步阐明多种菊科入侵植物共同入侵的环境生态效应及其关键驱动机理,以期为有效实现其环境风险评估和预警防控奠定强力的理论支撑和科学依据。
基于此,我所王从彦研究团队(江苏大学入侵生物学研究团队)聚焦当前入侵生态学领域备受关注的重大前沿科学问题之一,并独辟蹊径,重点解析三种均起源于美洲的菊科入侵植物共同入侵介导的环境生态效应及其关键驱动机理,具体以小蓬草(Conyza canadensis (L.) Cronq.; 亦称加拿大蓬、加拿大飞蓬、小飞蓬、小白酒草、小白酒菊)、一年蓬(Erigeron annuus (L.) Pers.)和加拿大一枝黄花(Solidago canadensis L.)为研究材料,对比分析不同入侵类型(即:无入侵、一种入侵植物的单一入侵、两种入侵植物的共同入侵以及三种入侵植物的共同入侵)下植物群落物种多样性、群落可入侵性以及入侵植物的入侵强度及其对植物物种多样性影响幅度的差异,从而进一步阐明多种菊科入侵植物共同入侵的环境生态效应及其关键驱动机理。
本研究的主要结论具体如下:
(1)与未入侵相比,一种入侵植物的单一入侵和两种入侵植物的共同入侵总体上显著降低了植物物种多样性。
(2)与一种入侵植物的单一入侵和两种入侵植物的共同入侵相比,三种入侵植物的共同入侵总体上显著增加了植物物种多样性和群落可入侵性。
(3)三种入侵植物中,一年蓬的入侵强度相对高于小蓬草和加拿大一枝黄花。
(4)共同入侵下,三种入侵植物的生态位非常相似。
(5)入侵植物种类数量正向调控入侵植物总盖度、植物多样性、植物优势度、植物均匀度和群落可入侵性。
(6)群落可入侵性主要受入侵植物总盖度、植物均匀度和植物丰富度的正向调控。
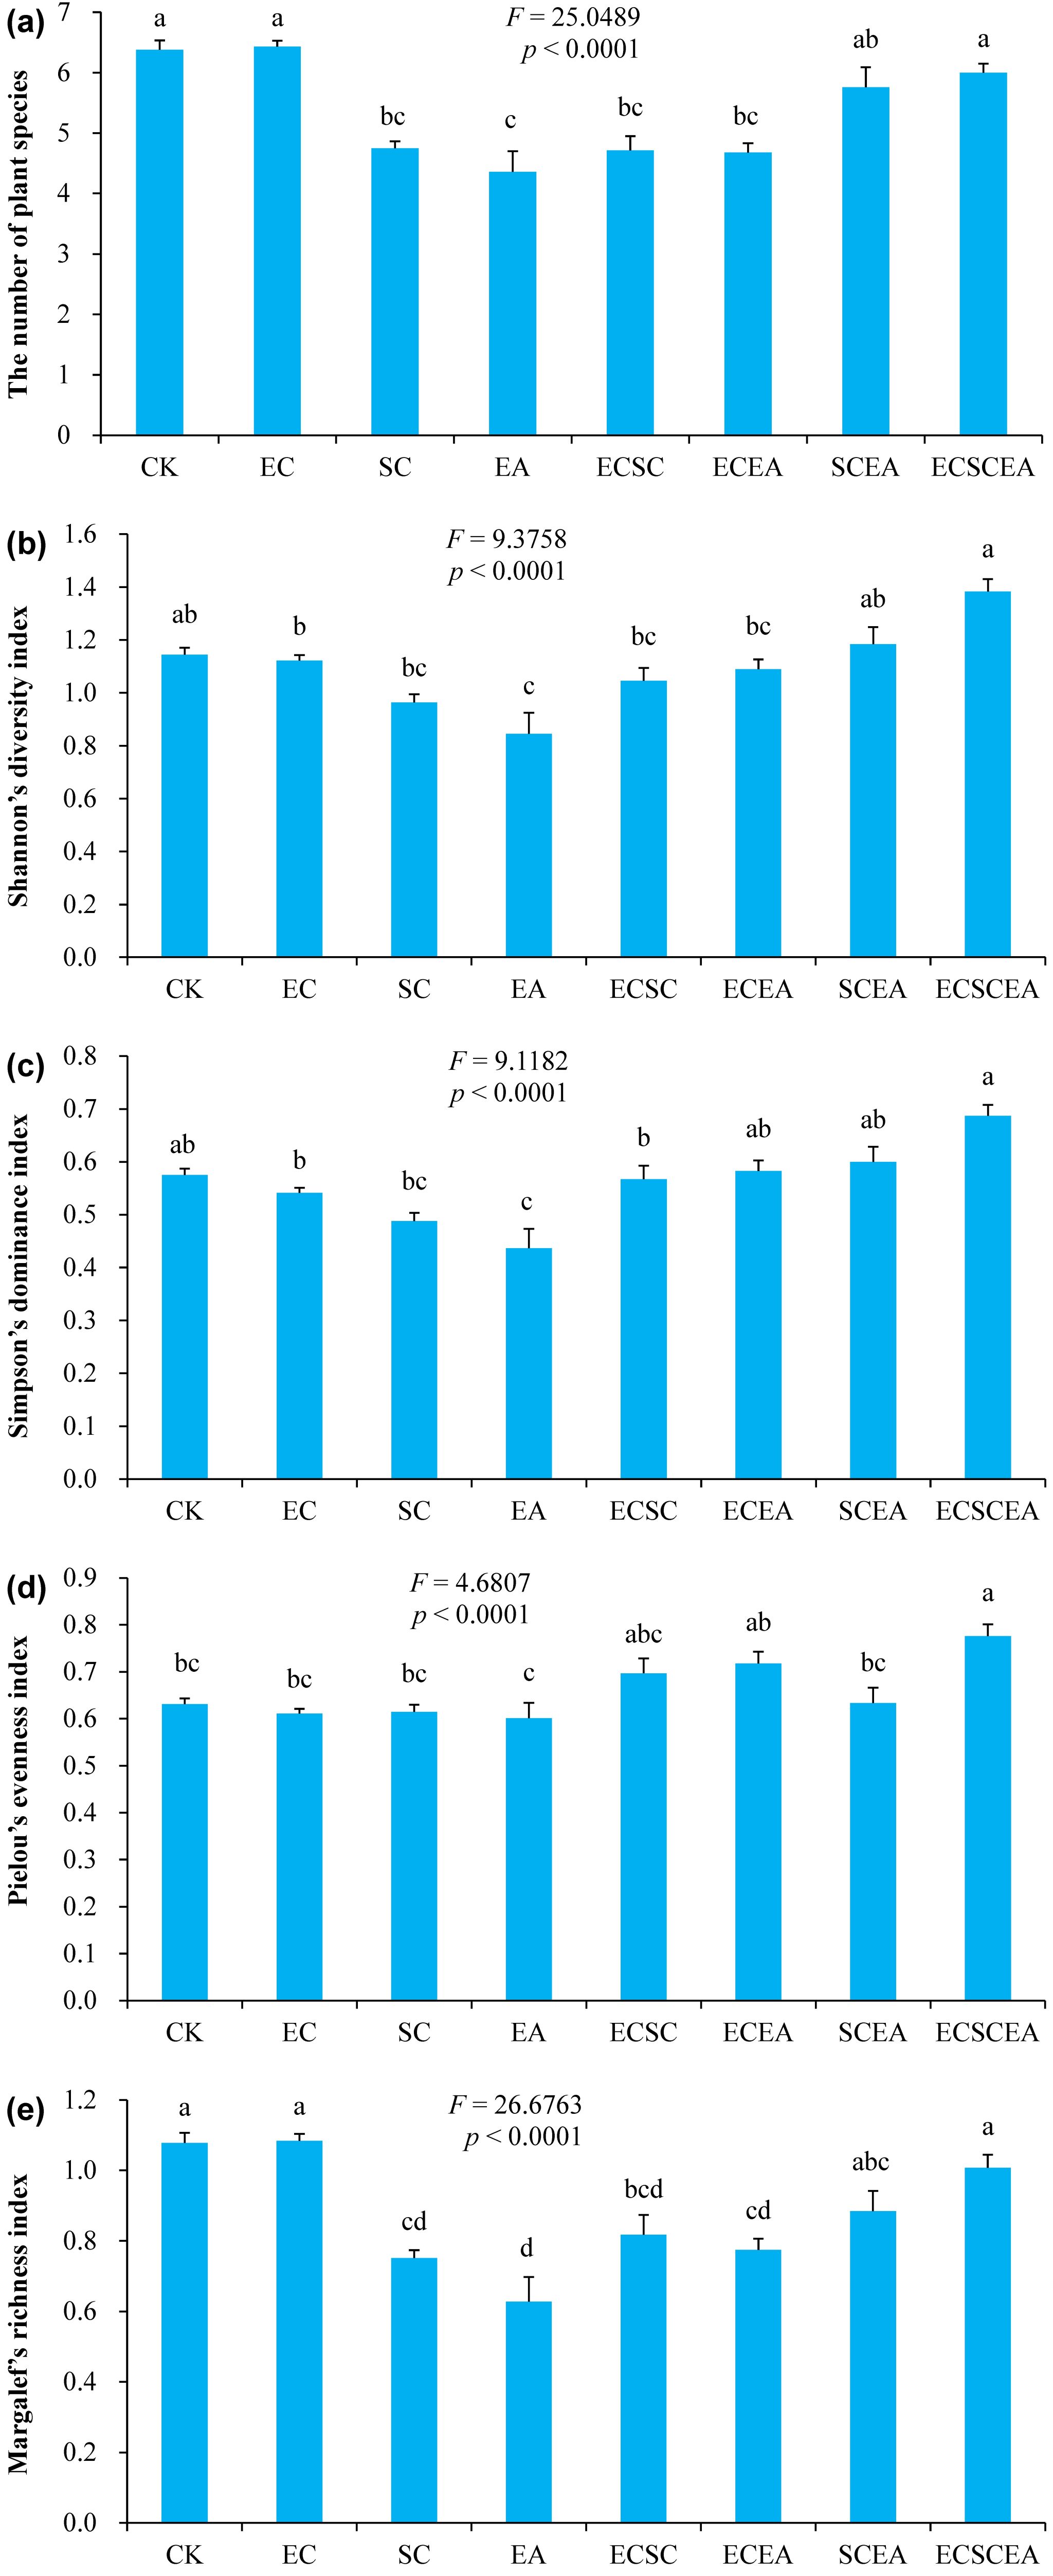
Fig. 1 Differences in plant taxonomic diversity indices under different invasion scenarios. (a) Number of plant species; (b) Shannon’s diversity index; (c) Simpson’s dominance index; (d) Pielou’s evenness index; (e) Margalef’s richness index. Data (means ± SE). Different letters indicate statistically significant differences at 0.05 probability. Abbreviations: CK, the control (without invasion) (n = 221); EC, the invasion of E. canadensis (n = 275); SC, the invasion of S. canadensis (n = 237); EA, the invasion of E. annuus (n = 51); ECSC, the co-invasion of E. canadensis and S. canadensis (n = 28); ECEA, the co-invasion of E. canadensis and E. annuus (n = 28); SCEA, the co-invasion of S. canadensis and E. annuus (n = 42); ECSCEA, the co-invasion of E. canadensis, S. canadensis, and E. annuus (n = 31).
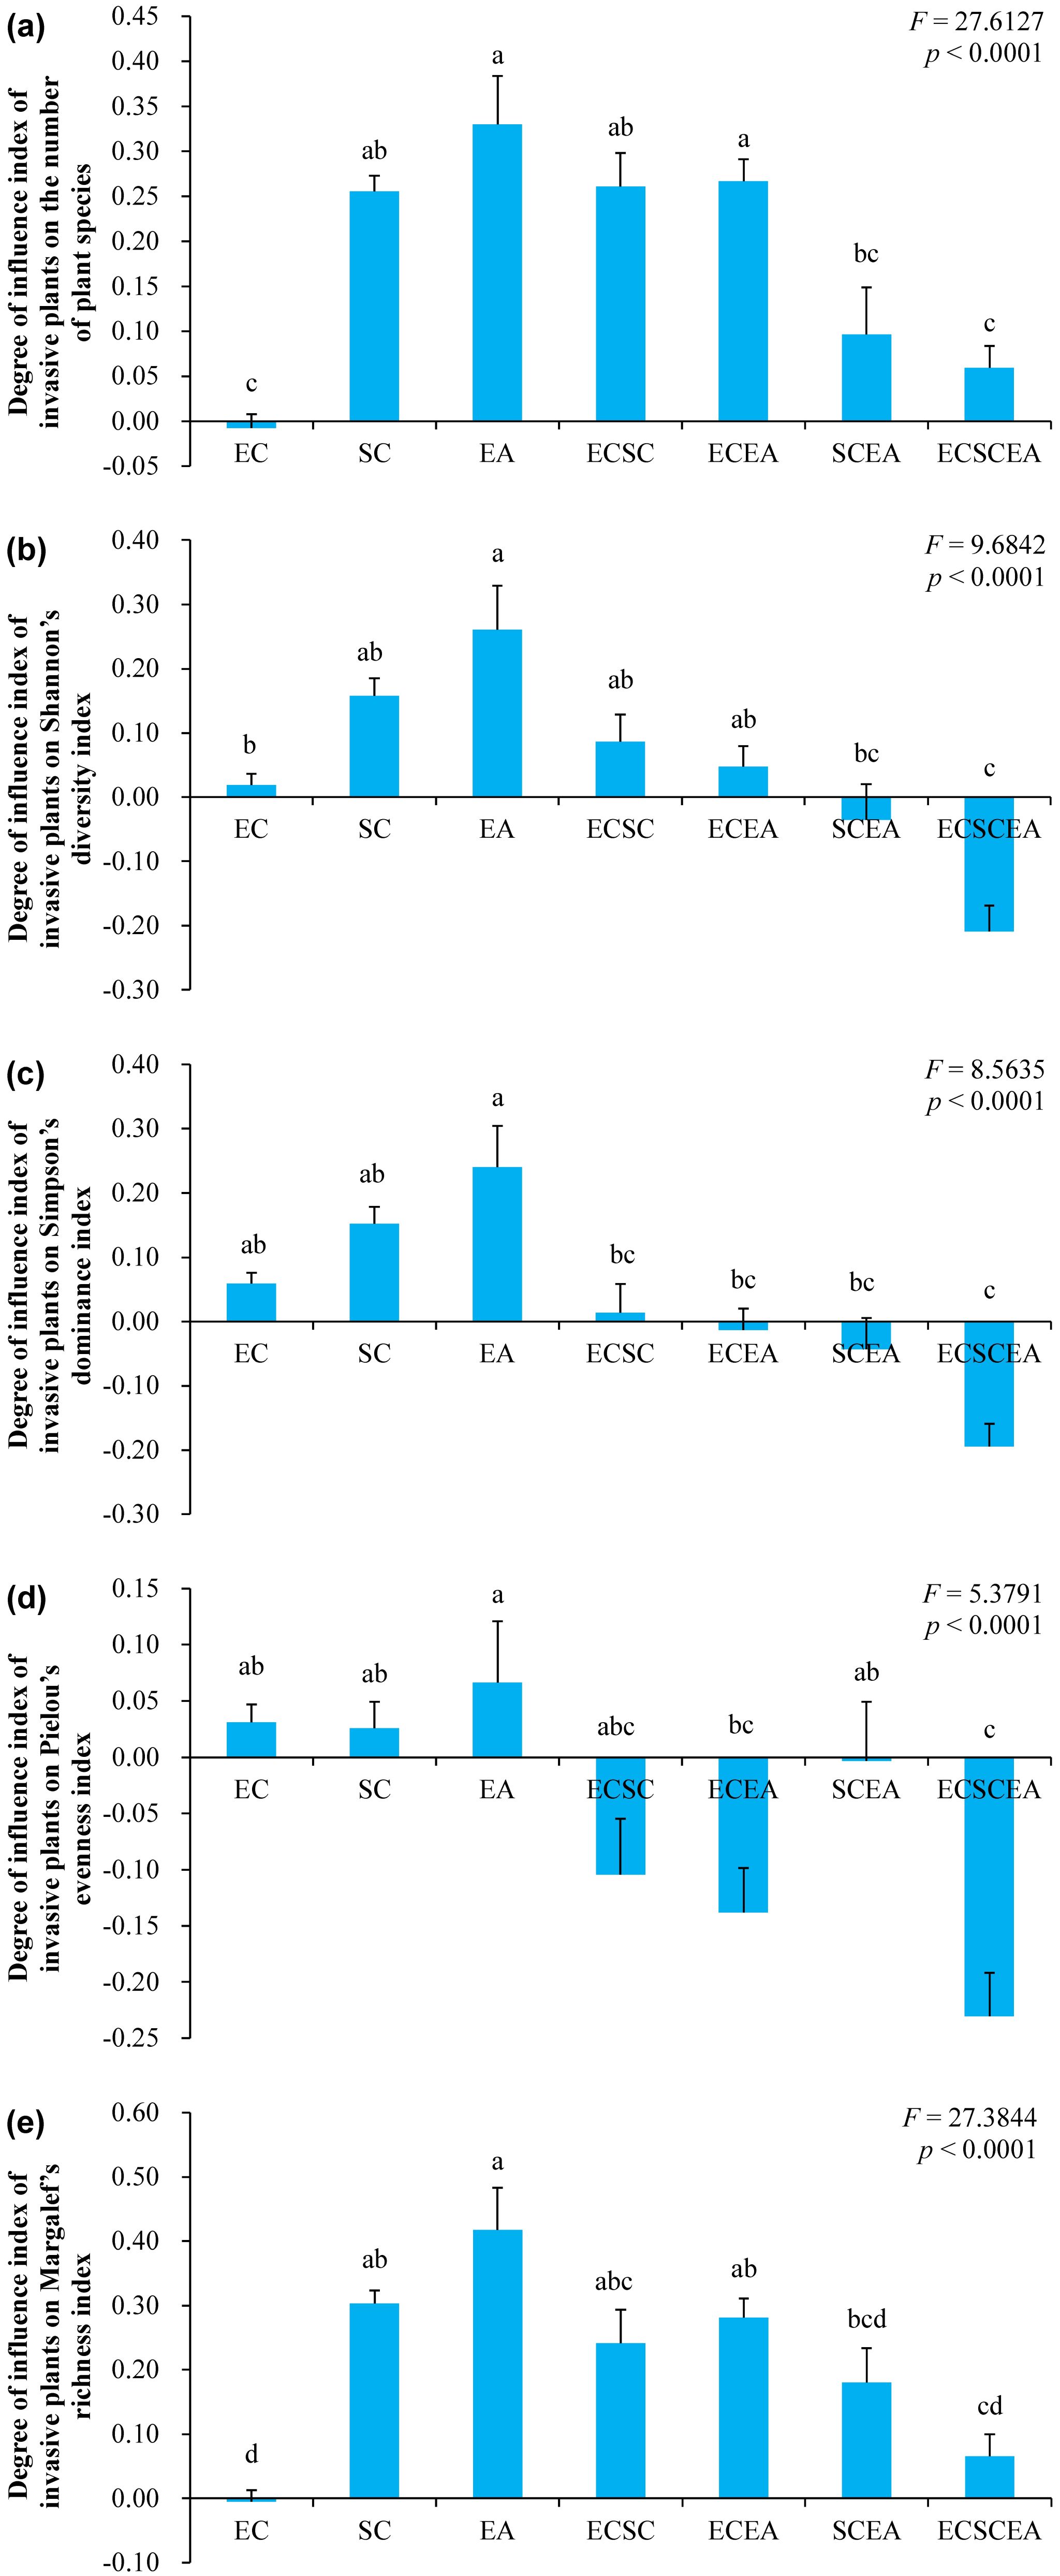
Fig. 2 Differences in the degree of influence index of invasive alien plants on plant taxonomic diversity in invaded communities. (a) Degree of influence index of invasive alien plants on the number of plant species. (b) Degree of influence index of invasive alien plants on the Shannon’s diversity index. (c) Degree of influence index of invasive alien plants on the Simpson’s dominance index. (d) Degree of influence index of invasive alien plants on the Pielou’s evenness index (e) Degree of influence index of invasive alien plants on the Margalef’s richness index. Data (means ± SE). Different letters indicate statistically significant differences at 0.05 probability. Abbreviations same as in Fig. 1.
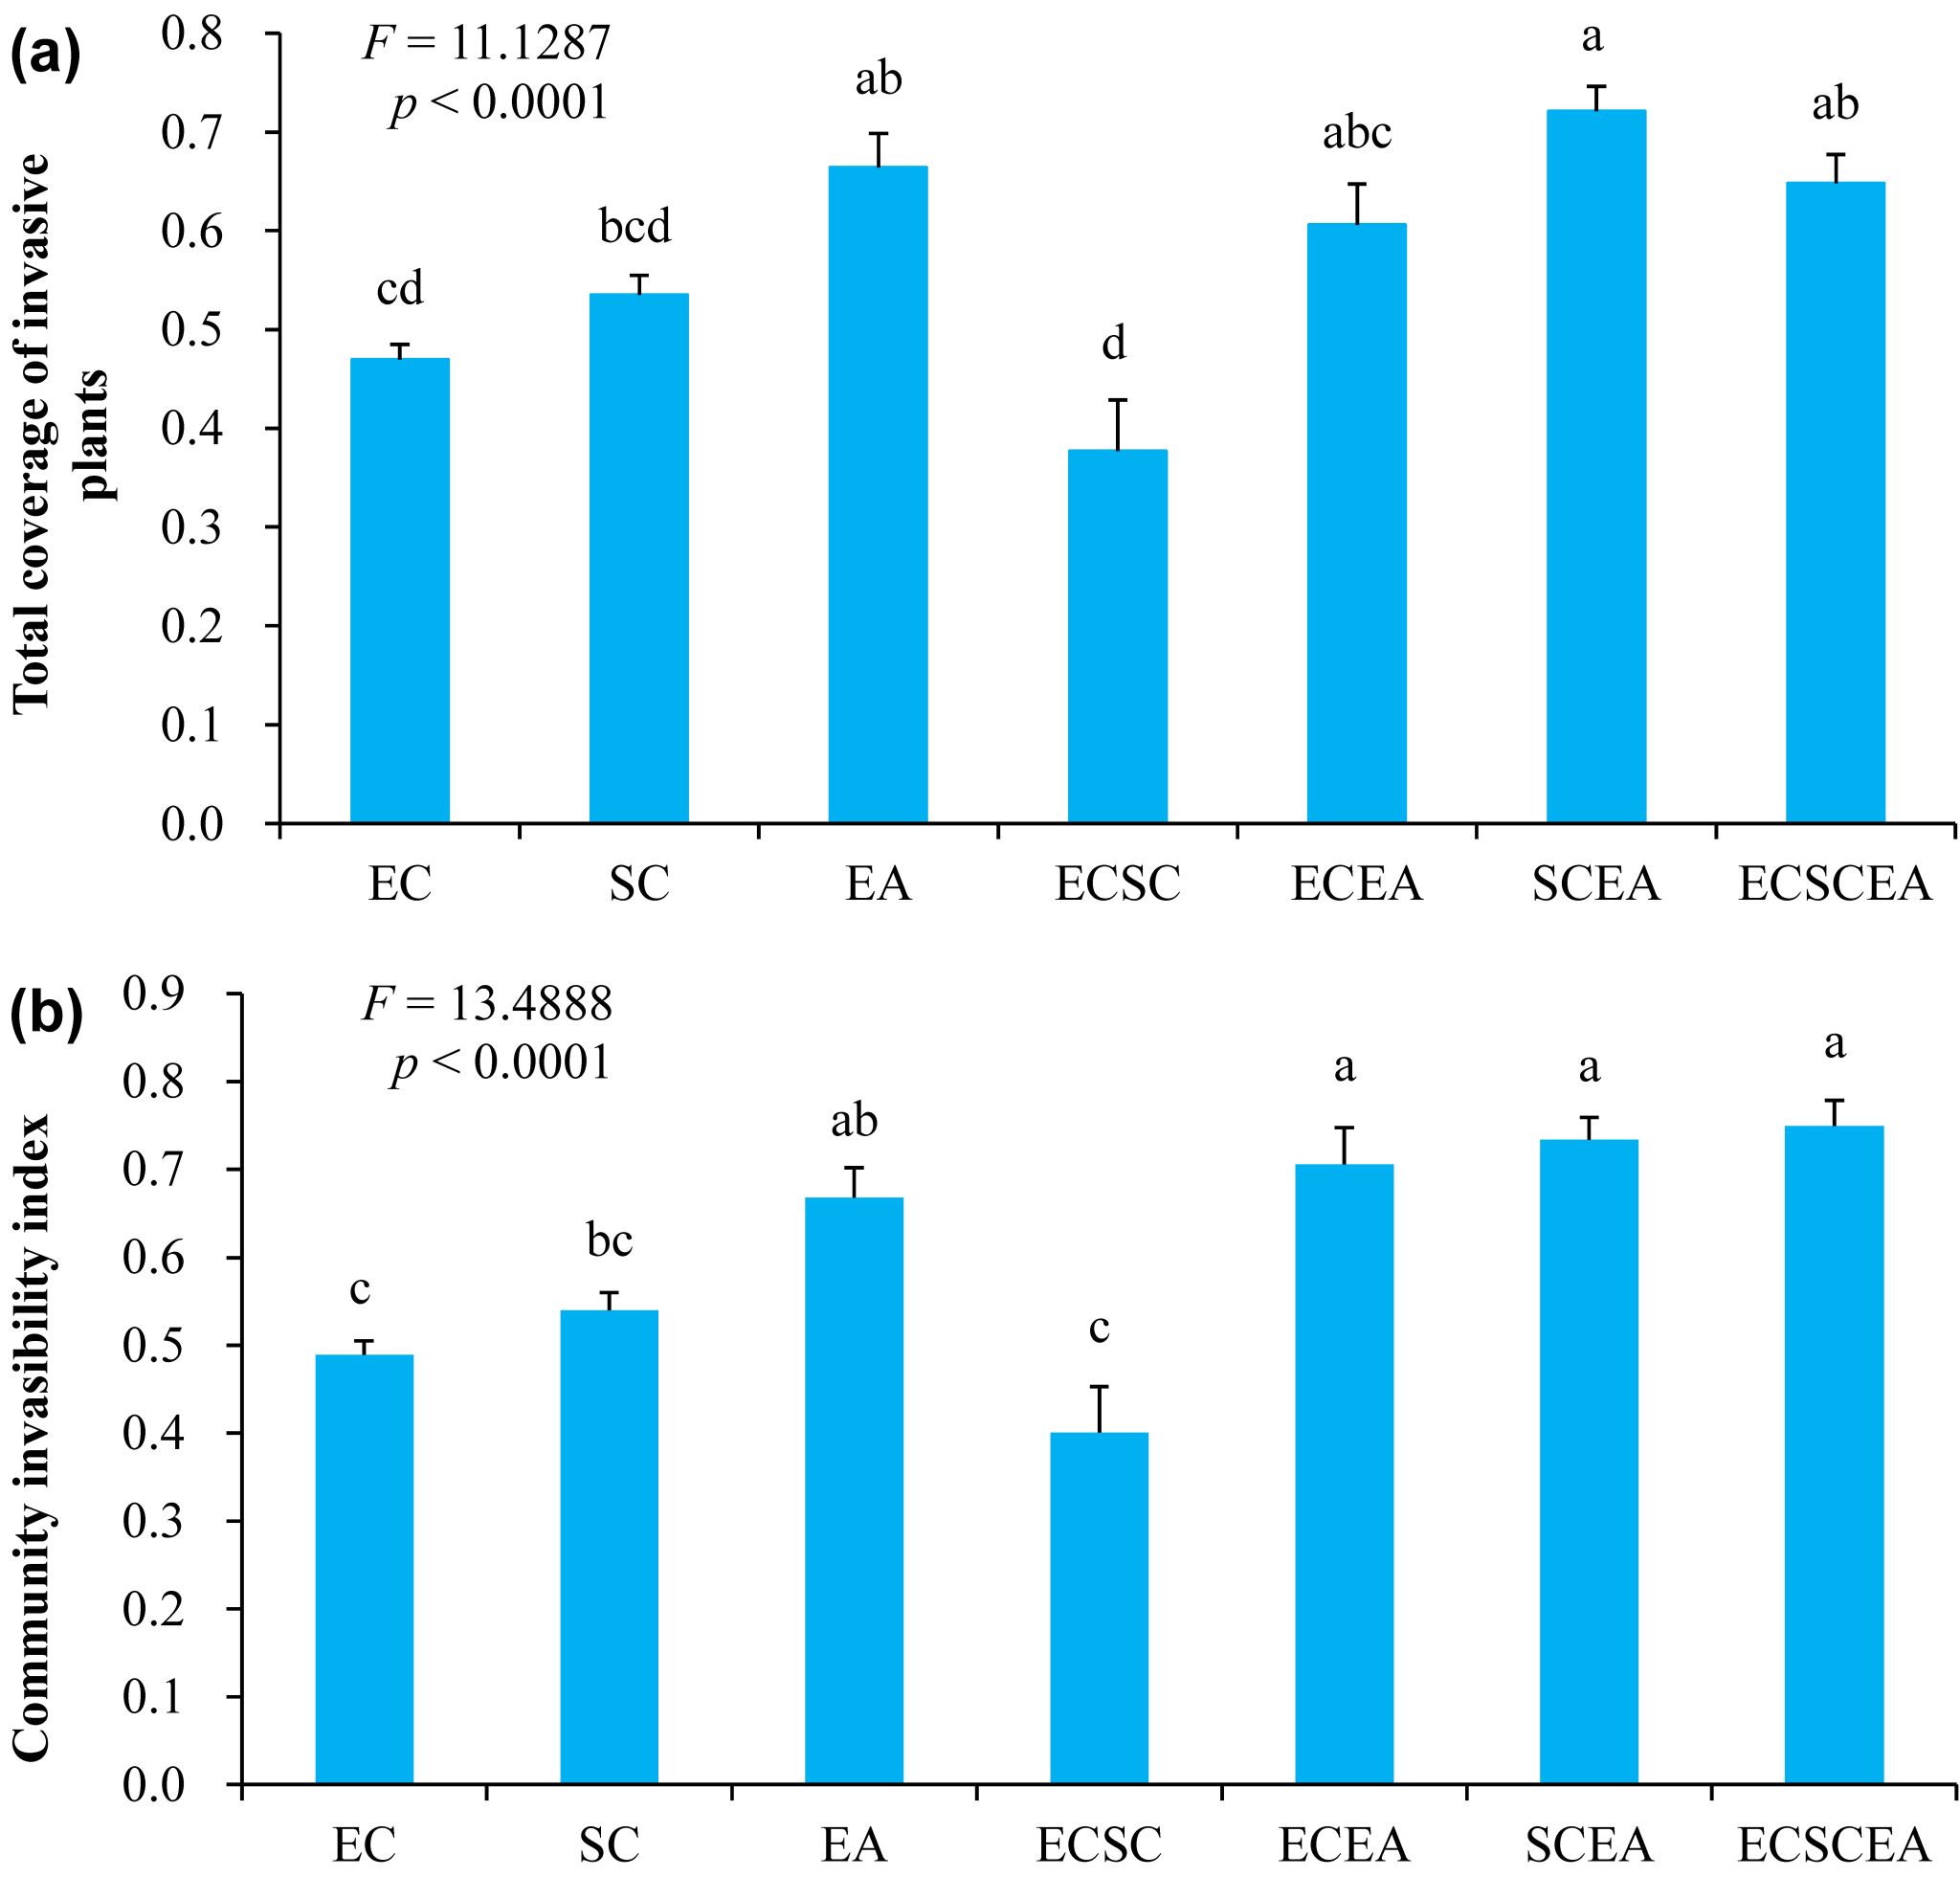
Fig. 3 Differences in the total coverage of invasive alien plants (a) and the community invasibility index (b) in the invaded communities. Data (means ± SE). Different letters indicate statistically significant differences at 0.05 probability. Abbreviations same as in Fig. 1.
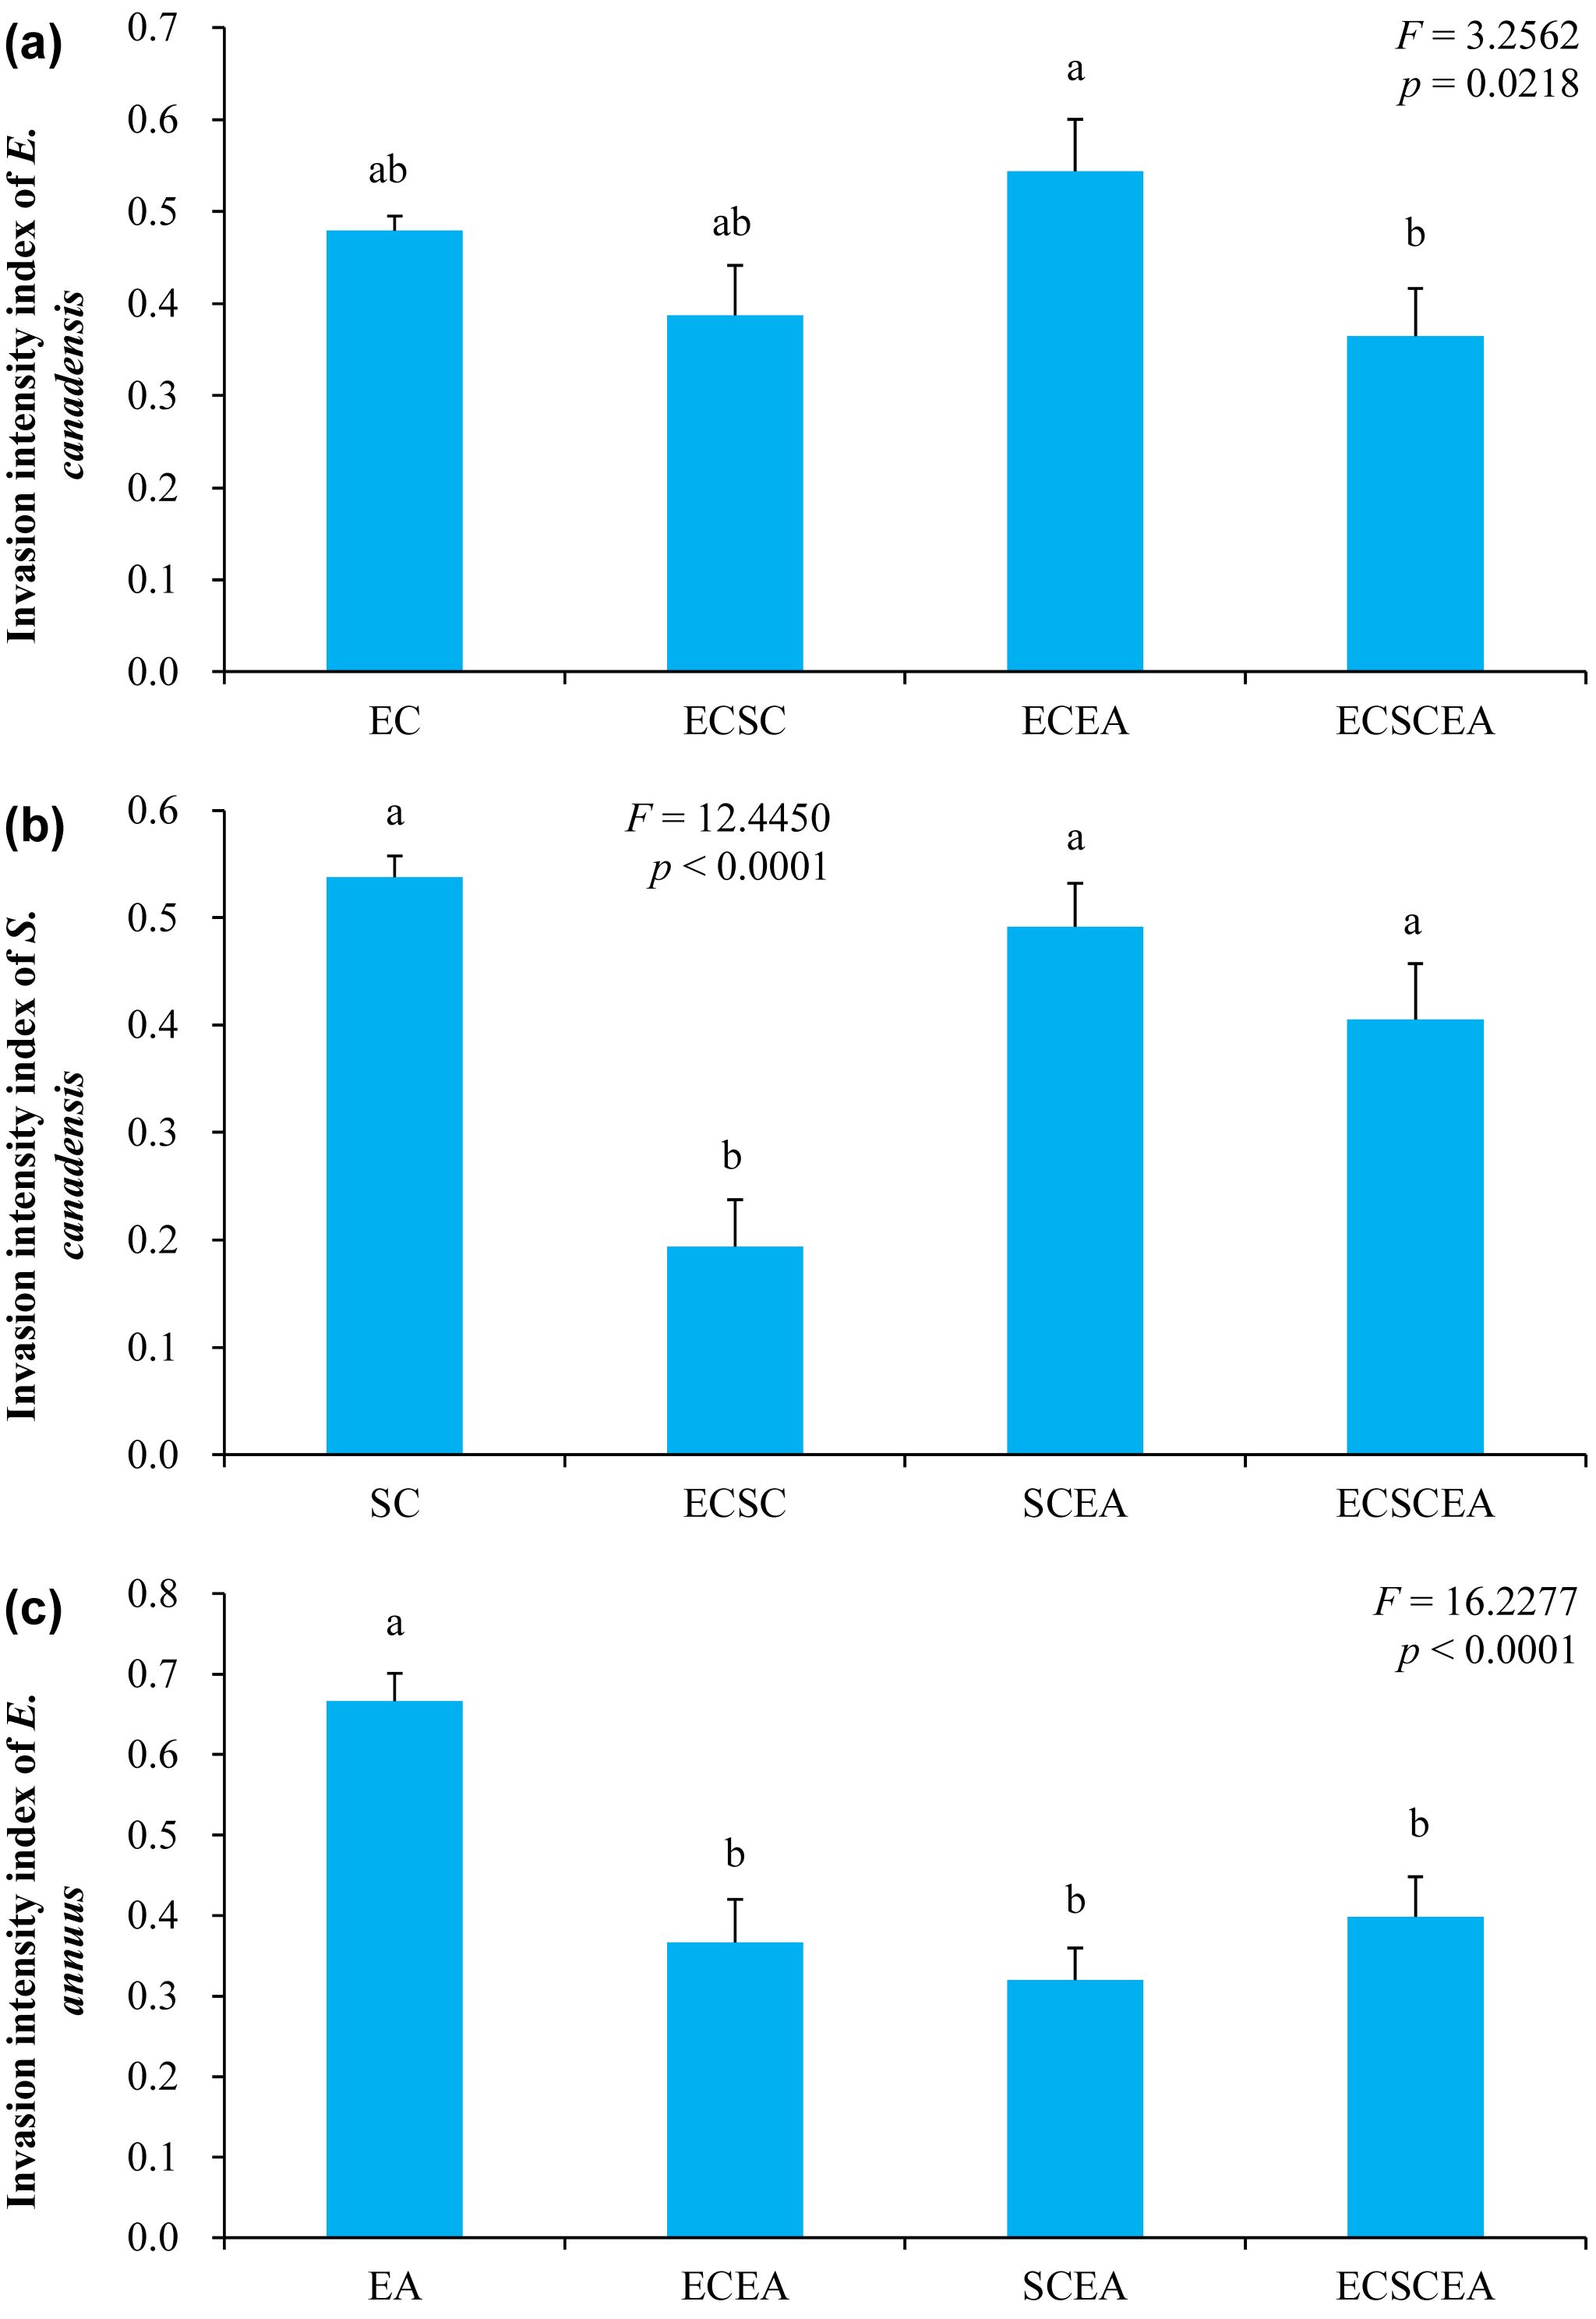
Fig. 4 Differences in the invasion intensity index of invasive alien plants in the invaded communities (a) invasion intensity index of E. canadensis; (b) invasion intensity index of S. canadensis; (c) invasion intensity index of E. annuus. Data (means ± SE). Different letters indicate statistically significant differences at 0.05 probability. Abbreviations same as in Fig. 1.
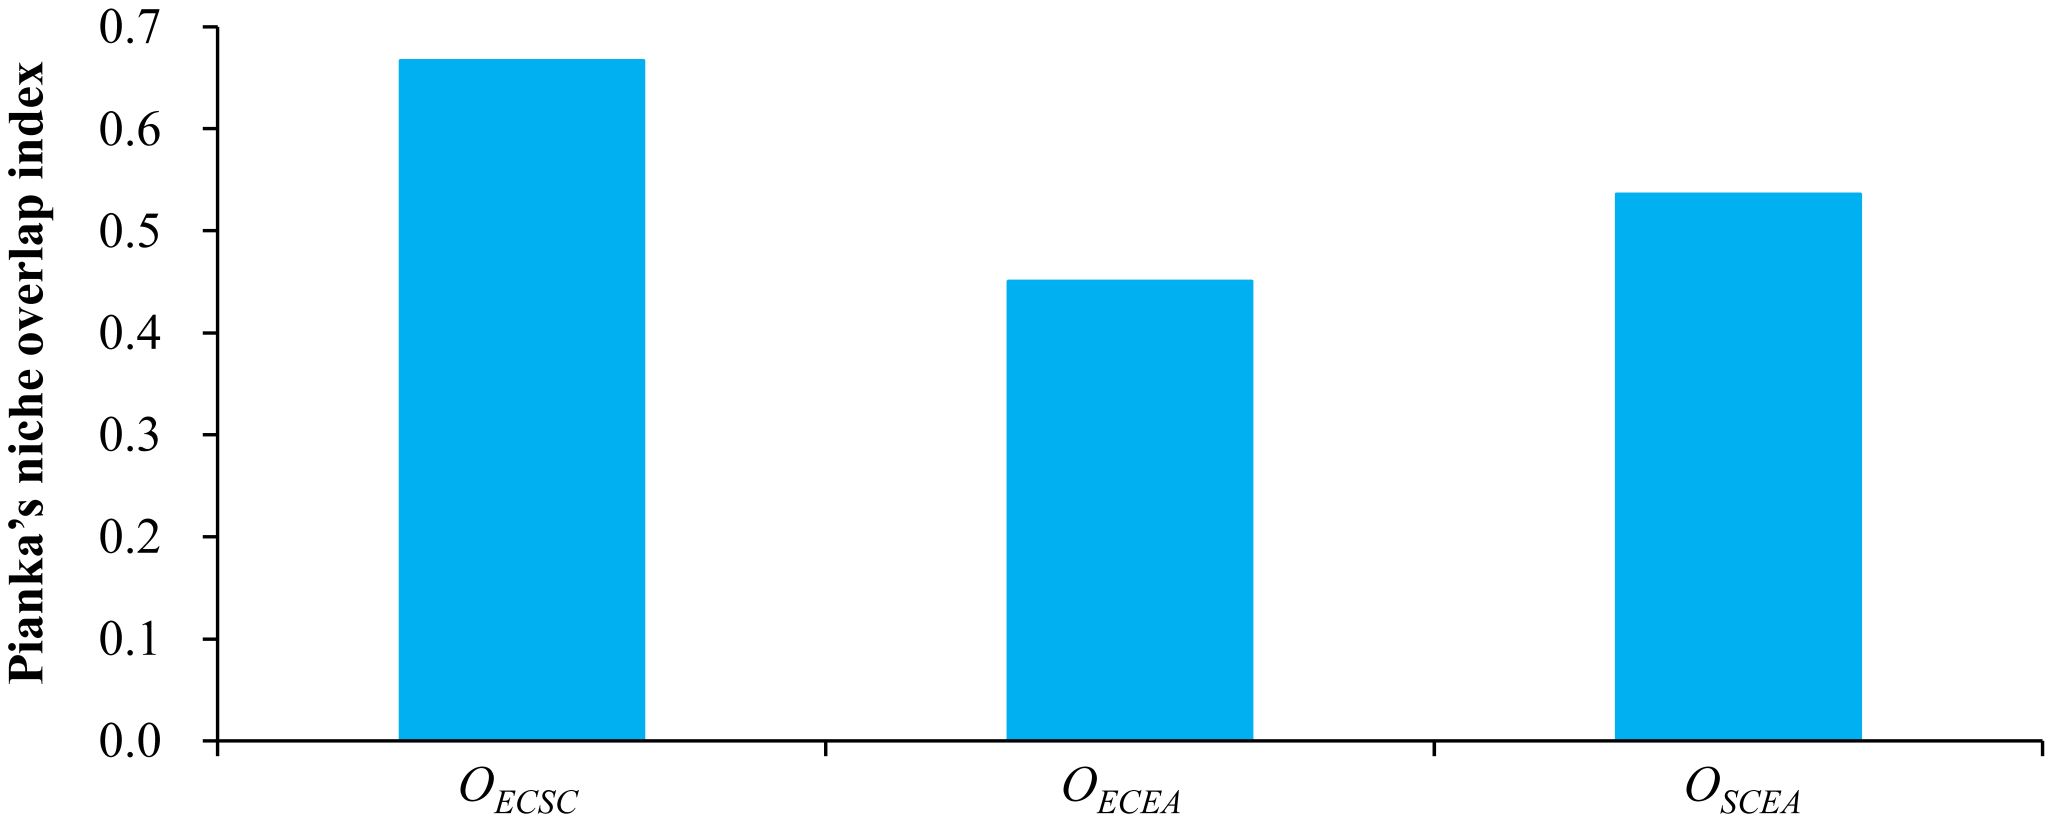
Fig. 5 Differences in the Pianka’s niche overlap index under co-invasion of E. canadensis, S. canadensis, and E. annuus. Abbreviations: OECSC, the Pianka’s niche overlap index between E. canadensis and S. canadensis; OECEA, the Pianka’s niche overlap index between E. canadensis and E. annuus; OSCEA, the Pianka’s niche overlap index between S. canadensis and E. annuus.
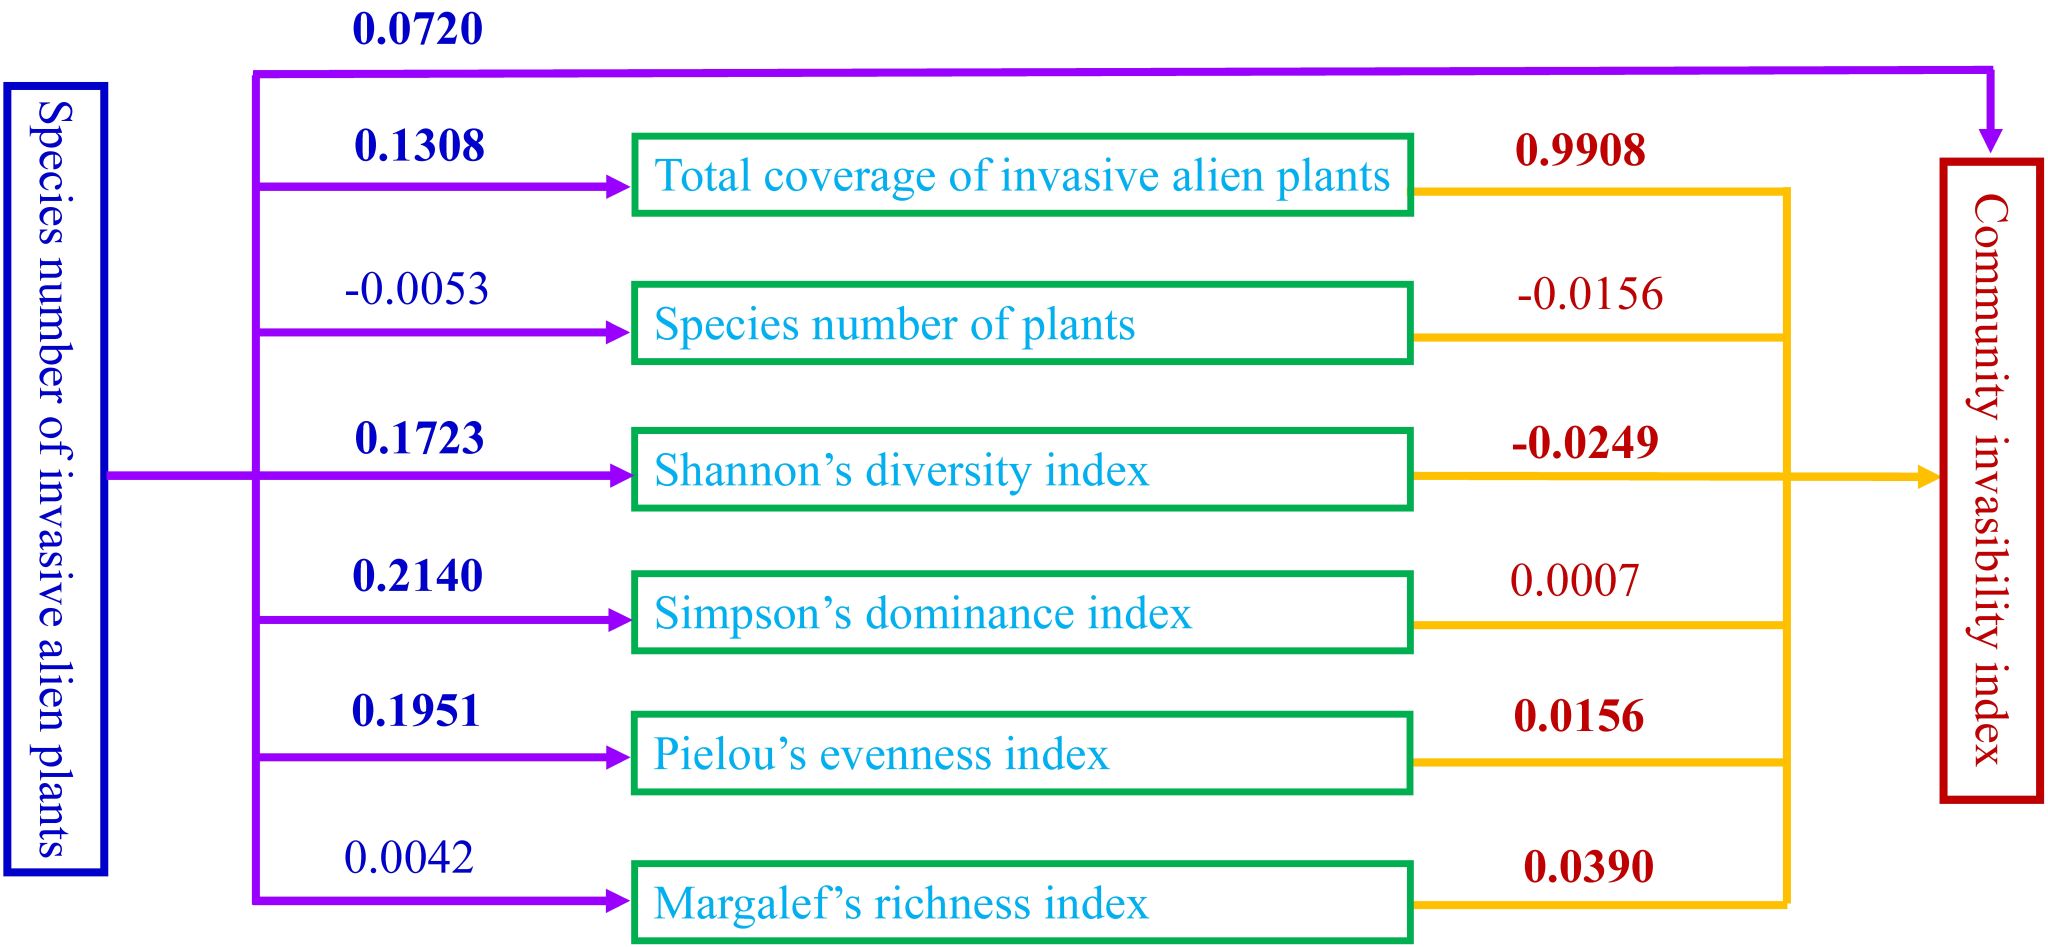
Fig. 6 Schematic diagram of the influences of the species number of invasive alien plants on their total coverage, plant taxonomic diversity indices, and the community invasibility index, as well as the influences of the total coverage of invasive alien plants and plant taxonomic diversity indices on the community invasibility index in the invaded communities. The blue numbers represent the influences of the species number of invasive alien plants on their total coverage, plant taxonomic diversity indices, and the community invasibility index in the invaded communities. The fuchsia numbers represent the influences of the total coverage of invasive alien plants and plant taxonomic diversity indices on the community invasibility index in the invaded communities. Positive values indicate positive influences, while negative values indicate negative influences. The stronger the influence, the greater the deviation from 0; and vice versa. p values equal to or less than 0.05 are shown in bold.
全文链接:https://doi.org/10.1016/j.pld.2025.05.013